
For this project’s requirements, a Raspberry Pi Zero became the obvious choice for Thinus.
“There are numerous commercial environment loggers on the market to monitor cargo, but the client also wanted to have a visual record of the whole sea voyage. The requirements for the logger system were: to be powered by battery, low power consumption, low component costs, to allow the use of custom programming code, [and] consist of easy-to-come-by, off-the-shelf components. They also wanted flexibility – the ability to reuse the system components for other projects in the future. The sensor readings and photos would also be stored on a USB flash drive for easy collection… Raspberry Pi Zero checked all the boxes for the above requirements.”
Potato stats
Running continuously for 40 days is no real problem for a Linux-powered box like Raspberry Pi – there are several out there that have logged over 1000 days’ uptime – however, there’s no handy plug socket for Raspberry Pi to use here.
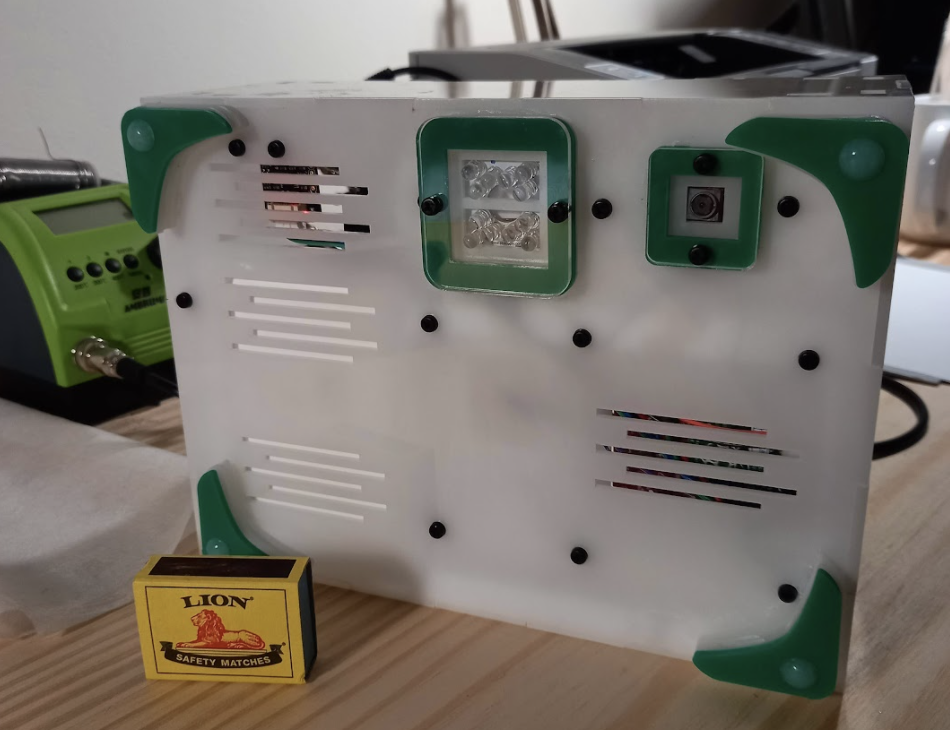
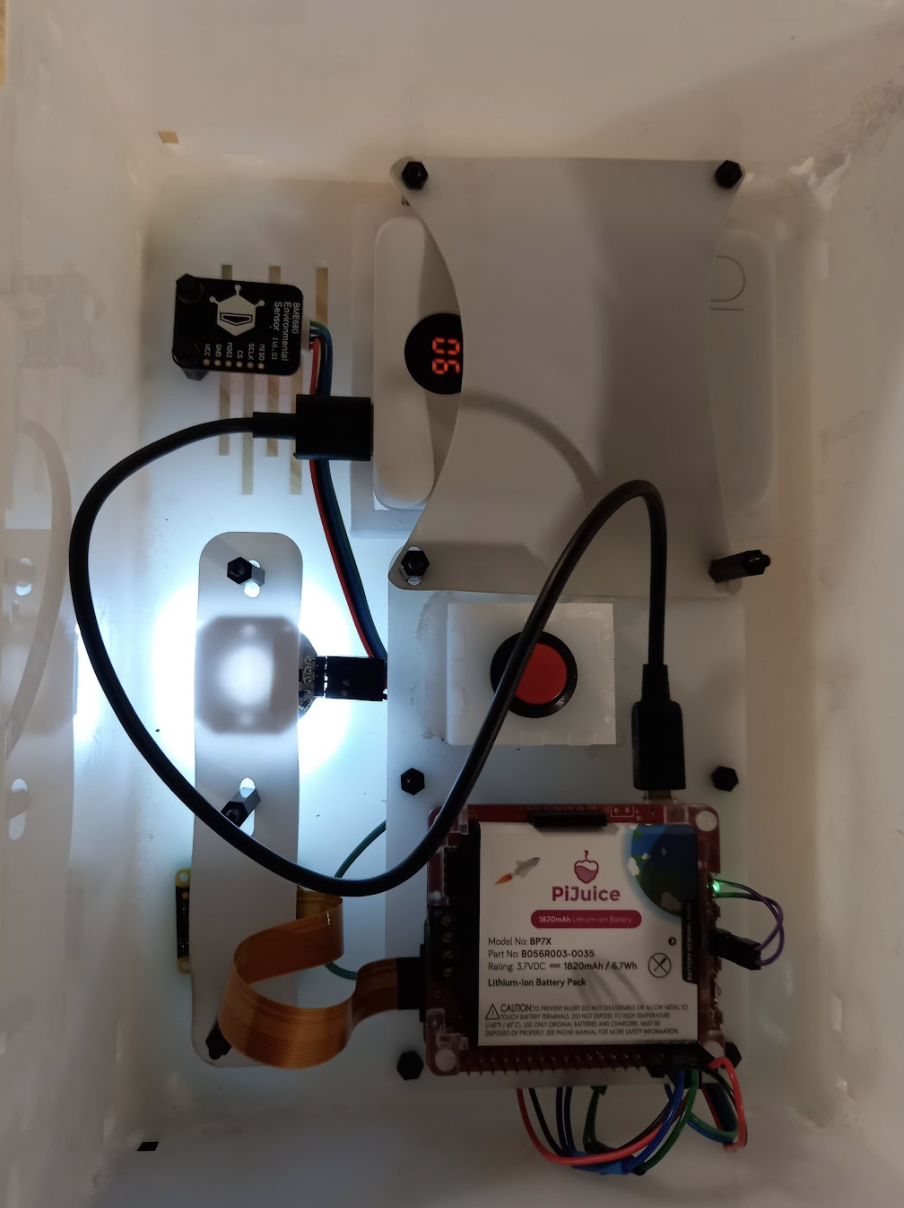
To conserve as much power as possible, a PiJuice HAT with a power supply and a real-time clock was used to power on the system once a day for just five minutes to do its job.
“Once Raspberry Pi was switched on, the temperature, humidity, and atmospheric pressure readings were taken and written to the USB flash drive,” Thinus explains. “As a failsafe, the data is also written to the SD card of Raspberry Pi.”
Thinus describes it working as follows. During the start-up process, crontab events at reboot are scheduled to:
– Take a photo after 45 seconds using a Bash script to:
◦Switch on the bright LED and take a photo with the Pi camera and save it to the SD card
◦Switch off the bright LED and switch on the infrared LED
◦Take an infrared photo with the camera and save it to the SD card
◦Copy the photos to the USB drive
– Read the sensor data after 30 seconds with a Python script:
◦Write the measurements for the temperature, humidity, and atmospheric pressure to a log file on the SD card
◦Copy the log file to the flash drive
– Set the PiJuice shutdown trigger for shutting down using a Python script.
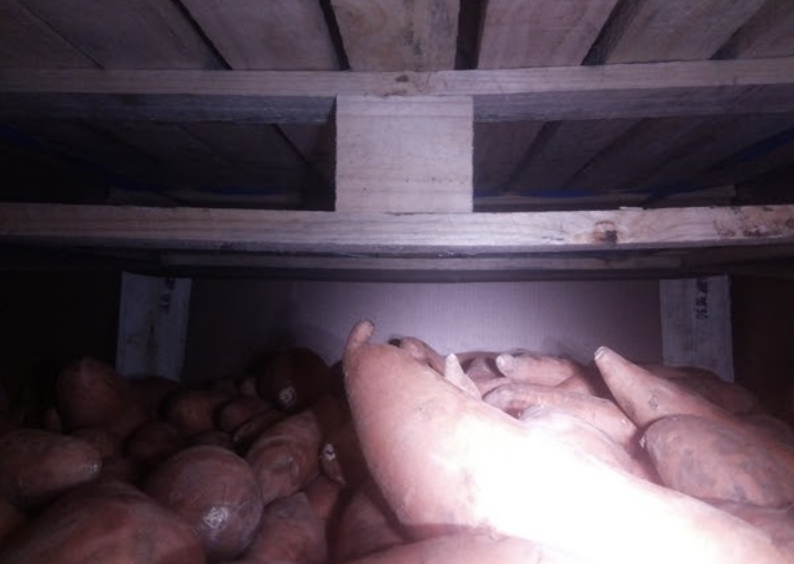
Tuber analysis
Using results from the logger, the farm has put measures in place to reduce transit time for their sweet potatoes. The data also revealed some interesting stats, such as the big temperature shifts mainly occurring on the 1000 km journey from the farm to the harbour, and the unloading of the cargo at the destination. The potatoes also noticeably shrank over the course of the journey.
“It worked very well, and for longer than anticipated,” Thinus mentions.
Schreibe einen Kommentar
Du musst angemeldet sein, um einen Kommentar abzugeben.