Add a sensor and some Python 3 to your Raspberry Pi to keep tabs on your local air pollution, in the project taken from Hackspace magazine issue 21.
Air is the very stuff we breathe. It’s about 78% nitrogen, 21% oxygen, and 1% argon, and then there’s the assorted ‘other’ bits and pieces – many of which have been spewed out by humans and our related machinery. Carbon dioxide is obviously an important polluter for climate change, but there are other bits we should be concerned about for our health, including particulate matter. This is just really small bits of stuff, like soot and smog. They’re grouped together based on their size – the most important, from a health perspective, are those that are smaller than 2.5 microns in width (known as PM2.5), and PM10, which are between 10 and 2.5 microns in width. This pollution is linked with respiratory illness, heart disease, and lung cancer.
Obviously, this is something that’s important to know about, but it’s something that – here in the UK – we have relatively little data on. While there are official sensors in most major towns and cities, the effects can be very localised around busy roads and trapped in valleys. How does the particular make-up of your area affect your air quality? We set out to monitor our environment to see how concerned we should be about our local air.
Getting started
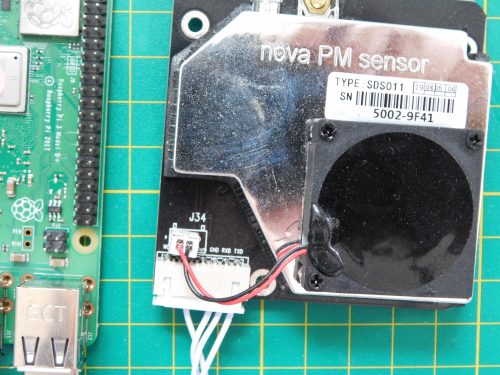
We picked the SDS011 sensor for our project (see ‘Picking a sensor’ below for details on why). This sends output via a binary data format on a serial port. You can read this serial connection directly if you’re using a controller with a UART, but the sensors also usually come with a USB-to-serial connector, allowing you to plug it into any modern computer and read the data.
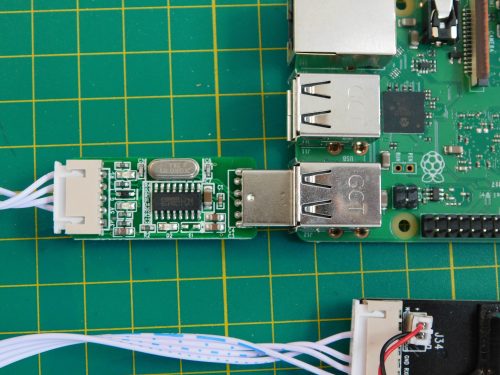
The USB-to-serial connector makes it easy to connect the sensor to a computer
The very simplest way of using this is to connect it to a computer. You can read the sensor values with software such as DustViewerSharp. If you’re just interested in reading data occasionally, this is a perfectly fine way of using the sensor, but we want a continuous monitoring station – and we didn’t want to leave our laptop in one place, running all the time. When it comes to small, low-power boards with USB ports, there’s one that always springs to mind – the Raspberry Pi.
First, you’ll need a Raspberry Pi (any version) that’s set up with the latest version of Raspbian, connected to your local network, and ideally with SSH enabled. If you’re unsure how to do this, there’s guidance on the Raspberry Pi website.

The wiring for this project is just about the simplest we’ll ever do: connect the SDS011 to the Raspberry Pi with the serial adapter, then plug the Raspberry Pi into a power source.
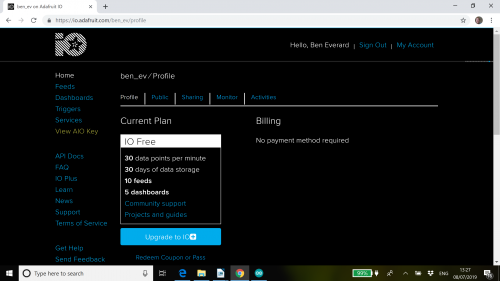
Before getting started on the code, we also need to set up a data repository. You can store your data wherever you like – on the SD card, or upload it to some cloud service. We’ve opted to upload it to Adafruit IO, an online service for storing data and making dashboards. You’ll need a free account, which you can sign up for on the Adafruit IO website – you’ll need to know your Adafruit username and Adafruit IO key in order to run the code below. If you’d rather use a different service, you’ll need to adjust the code to push your data there.
We’ll use Python 3 for our code, and we need two modules – one to read the data from the SDS011 and one to push it to Adafruit IO. You can install this by entering the following commands in a terminal:
pip3 install pyserial adafruit-io
You’ll now need to open a text editor and enter the following code:

This does a few things. First, it reads ten bytes of data over the serial port – exactly ten because that’s the format that the SDS011 sends data in – and sticks these data points together to form a list of bytes that we call data.
We’re interested in bytes 2 and 3 for PM2.5 and 4 and 5 for PM10. We convert these from bytes to integer numbers with the slightly confusing line:
pmtwofive = int.from_bytes(b’’.join(data[2:4]), byteorder=’little’) / 10
from_byte command takes a string of bytes and converts them into an integer. However, we don’t have a string of bytes, we have a list of two bytes, so we first need to convert this into a string. The b’’ creates an empty string of bytes. We then use the join method of this which takes a list and joins it together using this empty string as a separator. As the empty string contains nothing, this returns a byte string that just contains our two numbers. The byte_order flag is used to denote which way around the command should read the string. We divide the result by ten, because the SDS011 returns data in units of tens of grams per metre cubed and we want the result in that format aio.send is used to push data to Adafruit IO. The first command is the feed value you want the data to go to. We used kingswoodtwofive and kingswoodten, as the sensor is based in Kingswood. You might want to choose a more geographically relevant name. You can now run your sensor with:
python3 airquality.py
…assuming you called the Python file airquality.py
and it’s saved in the same directory the terminal’s in.
At this point, everything should work and you can set about running your sensor, but as one final point, let’s set it up to start automatically when you turn the Raspberry Pi on. Enter the command:
crontab -e
…and add this line to the file:
@reboot python3 /home/pi/airquality.py
With the code and electronic setup working, your sensor will need somewhere to live. If you want it outside, it’ll need a waterproof case (but include some way for air to get in). We used a Tupperware box with a hole cut in the bottom mounted on the wall, with a USB cable carrying power out via a window. How you do it, though, is up to you.
Now let’s democratise air quality data so we can make better decisions about the places we live.
Picking a sensor
There are a variety of particulate sensors on the market. We picked the SDS011 for a couple of reasons. Firstly, it’s cheap enough for many makers to be able to buy and build with. Secondly, it’s been reasonably well studied for accuracy. Both the hackAIR and InfluencAir projects have compared the readings from these sensors with more expensive, better-tested sensors, and the results have come back favourably. You can see more details at hsmag.cc/DiYPfg and hsmag.cc/Luhisr.
The one caveat is that the results are unreliable when the humidity is at the extremes (either very high or very low). The SDS011 is only rated to work up to 70% humidity. If you’re collecting data for a study, then you should discard any readings when the humidity is above this. HackAIR has a formula for attempting to correct for this, but it’s not reliable enough to neutralise the effect completely. See their website for more details: hsmag.cc/DhKaWZ.
Safe levels
Once you’re monitoring your PM2.5 data, what should you look out for? The World Health Organisation air quality guideline stipulates that PM2.5 not exceed 10 µg/m3 annual mean, or 25 µg/m324-hour mean; and that PM10 not exceed 20 µg/m3 annual mean, or 50 µg/m3 24-hour mean. However, even these might not be safe. In 2013, a large survey published in The Lancet “found a 7% increase in mortality with each 5 micrograms per cubic metre increase in particulate matter with a diameter of 2.5 micrometres (PM2.5).”
Where to locate your sensor
Standard advice for locating your sensor is that it should be outside and four metres above ground level. That’s good advice for general environmental monitoring; however, we’re not necessarily interested in general environmental monitoring – we’re interested in knowing what we’re breathing in.
Locating your monitor near your workbench will give you an idea of what you’re actually inhaling – useless for any environmental study, but useful if you spend a lot of time in there. We found, for example, that the glue gun produced huge amounts of PM2.5, and we’ll be far more careful with ventilation when using this tool in the future.
Adafruit IO
You can use any data platform you like. We chose Adafruit IO because it’s easy to use, lets you share visualisations (in the form of dashboards) with others, and connects with IFTTT to perform actions based on values (ours tweets when the air pollution is above legal limits).
One thing to be aware of is that Adafruit IO only holds data for 30 days (on the free tier at least). If you want historical data, you’ll need to sign up for the Plus option (which stores data for 60 days), or use an alternative storage method. You can use multiple data stores if you like.
Checking accuracy
Now you’ve got your monitoring station up and running, how do you know that it’s running properly? Perhaps there’s an issue with the sensor, or perhaps there’s a problem with the code. The easiest method of calibration is to test it against an accurate sensor, and most cities here in the UK have monitoring stations as part of Defra’s Automatic Urban and Rural Monitoring Network. You can find your local station here. Many other countries have equivalent public networks. Unless there is no other option, we would caution against using crowdsourced data for calibration, as these sensors aren’t themselves calibrated.
With a USB battery pack, you can head to your local monitoring point and see if your monitor is getting similar results to the monitoring network.
HackSpace magazine #21 is out now
You can read the rest of this feature in HackSpace magazine issue 21, out today in Tesco, WHSmith, and all good independent UK newsagents.
Or you can buy HackSpace mag directly from us — worldwide delivery is available. And if you’d like to own a handy digital version of the magazine, you can also download a free PDF.
Website: LINK